hope you enjoyed our previous newsletter of “Assessing Feasibility of Analytical Solution” and how it helps in future of predictive data analytics. Let’s continue to our previous discussion with new topic “Designing the Analytical Base Table”.
2.3 Designing the Analytical Base Table
Once we have decided which analytics solution we are going to develop in response to a business problem, we need to begin to design the data structures that will be used to build, evaluate, and ultimately deploy the model. This work sits primarily in the Data Understanding phase of the CRISP-DM process but also overlaps with the Business Understanding and Data Preparation phases (remember that the CRISP-DM process is not strictly linear).
To build a predictive model, we need a large dataset of historical examples of the scenario for which we will make predictions. Each of these historical examples must contain sufficient data to describe the scenario and for the outcome. The basic structure in which we capture these historical datasets is the analytics base table (ABT). An analytics base table is a simple, flat, tabular data structure made up of rows and columns. The columns are divided into a set of descriptive features and a single target feature. Each row contains a value for each descriptive feature and the target feature and represents an instance about which a prediction can be made.
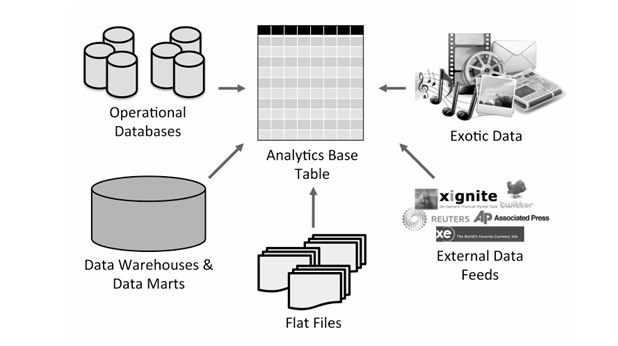
Although the ABT is the key structure that we use in developing machine learning models, a common challenge in machine learning projects are: raw organizational data is typically unstructured, messy, and scattered across various sources. Constructing an Analytical Base Table (ABT) requires extracting, cleaning, integrating, and transforming this raw data into a structured format suitable for predictive modeling. This process often involves:
Data Extraction: Retrieving data from multiple systems or databases.
Data Cleaning: Handling missing values, removing duplicates, and correcting errors.
Data Transformation: Converting raw data into meaningful features.
Integration: Merging data from various sources to create a comprehensive dataset.
This foundational step is critical, as the quality of the ABT significantly impacts the performance and accuracy of machine learning models.
Creating an Analytical Base Table (ABT) involves combining data from various organizational sources and carefully planning its design. The first step is to define the prediction subject, which is the main focus of the model. Each row in the ABT represents one instance of this subject and includes descriptive features (information used for predictions) and a target feature (the outcome to predict). Since defining these features can feel overwhelming, a helpful approach is to start with broad domain concepts and break them down into specific, actionable features. This method simplifies the process and ensures the ABT is tailored to the prediction goal.
Domain concepts are broad ideas that describe key characteristics of the subject being predicted, forming the foundation for features included in an Analytical Base Table (ABT). These concepts help bridge the gap between what experts know about the domain and the data-driven features needed for predictive modeling. The goal is to predict a target feature using descriptive features derived from these domain concepts.
For example, domain concepts like "customer value," "behavioral change," or "product usage mix" highlight areas that are likely to impact predictions. At this stage, these are just high-level ideas, not specific features. To make them actionable, analytics experts and domain experts work together to refine and break them down into measurable data points.
Common domain concepts include:
Demographics: Age, gender, occupation, and location.
Usage: How often or recently a customer interacted with a service, including the value of those interactions.
Changes in Usage: Variations in behavior, such as switching packages or increasing spending.
Special Usage: Unique interactions, like contacting support or using premium features.
Lifecycle Phase: Whether the customer is new, loyal, or about to leave.
Network Links: Connections between customers, products, or social networks.
This process requires close collaboration and often takes place over several meetings, where experts discuss and refine the domain concepts to ensure they align with the goals of the predictive model.
Case study: Motor insurance fraud
In the motor insurance fraud detection project, the goal is to build a model that predicts the likelihood of a claim being fraudulent. The system will flag suspicious claims for further investigation. The prediction subject here is an insurance claim, so the Analytical Base Table (ABT) will include historical claims with descriptive features that indicate possible fraud and a target feature showing whether a claim was ultimately fraudulent.
The domain concepts for this problem come from the insurance domain and are determined through collaboration between analytics practitioners and business domain experts. These include:
Policy Details: Information about the claimant’s policy, like its age and type.
Claim Details: Information about the claim itself, such as the incident type and claim amount.
Claimant History: Past claims made by the claimant, including the types of claims and their frequency.
Claimant Links: Relationships between the claimant and others involved in the claim (e.g., repeated claims with the same individuals).
Claimant Demographics: Information about the claimant, such as age, gender, and occupation.
Fraud Outcome: The target feature indicating whether the claim is fraudulent, which often requires combining data from multiple sources.
Some domain concepts are further refined into subconcepts. For example:
Claimant History includes Claim Types (types of past claims) and Claim Frequency (how often claims are made).
Claimant Links is split into Links with Other Claims and Links with Current Claim, focusing on connections to past or ongoing claims.
Each domain concept or subconcept leads to specific descriptive features derived from organizational data. These features collectively form the ABT, which is essential for building the predictive model.
Thank you for joining us! if you enjoyed this edition, consider giving it a like. We’d love to hear your thoughts-drop a comment below!
In next episode we will continue our topic with “Designing and Implementing Features.”